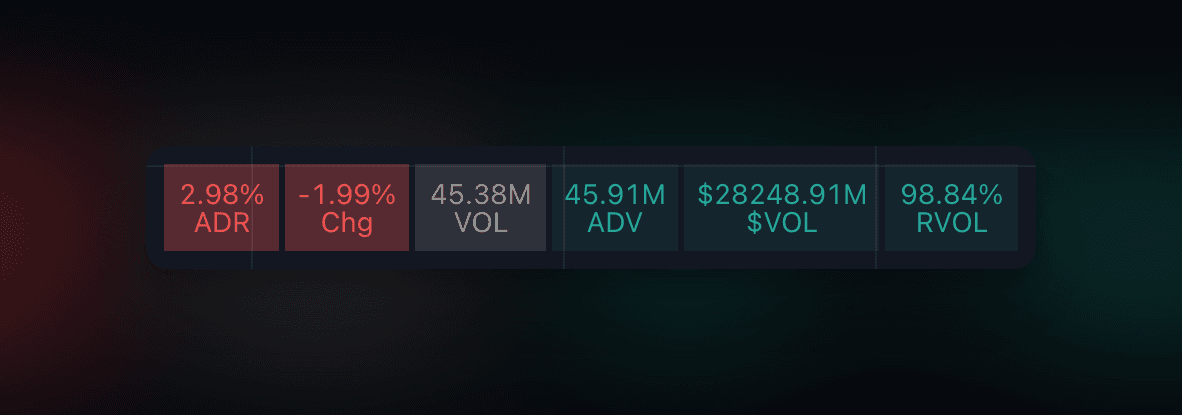
In this article, I will show you how to develop an indicator for TradingView entwickeln kannst. As an example, I will use an indicator that displays the key metrics for analyzing stocks.

- Aufbau des Indikators
- Definition der Eingabeparameter
- Berechnung der Kennzahlen
- Darstellung der Kennzahlen im Chart
- Ressourcen
Structure of the Indicator
The indicator consists of three parts. There's the actual calculation of the metrics, the display of these metrics in the chart, and we also want to give users the ability to customize the values and thresholds for the metrics individually.
The structure of the indicator is as follows:
- Definition of input parameters
- Calculation of the metrics
- Display of the metrics in the chart
Definition of Input Parameters
First, we define the indicator and the input parameters. The input parameters are the values that users can customize individually. In our case, these are the threshold values for the metrics.
//@version=5
indicator("Test Titel", shorttitle="Test", overlay=true)

// Inputs
adrLength = input(defval=20, title="ADR period")
adrThresh = input(defval=3, title="ADR Threshold")
advLength = input(defval=21,title="ADV period")
dvolThresh = input(defval=50,title="$Vol Threshold in M")
tableOrientation = input.string(defval = "vertical", title = "Orientation of Dashboard", options = ["vertical", "horizontal"])
tablePosition = input.string(defval= position.top_right, options = [position.bottom_right, position.bottom_left, position.top_right, position.top_left])adrLengthdefines the number of days used for calculating the Average Daily Range (ADR).adrThreshis the threshold value for the ADR.advLengthdefines the number of days used for calculating the Average Daily Volume (ADV).dvolThreshis the threshold value for the ADV.tableOrientationdefines the orientation of the dashboard.tablePositiondefines the position of the dashboard in the chart.
Calculation of the Metrics
As an example, I will show you the calculation of the Average Daily Range (ADR) and the percentage change. The calculation of the other metrics is done analogously.
// Definitions - calculated values
adrValue = request.security(syminfo.tickerid, 'D', ta.sma((high/low-1)[1]*100,adrLength))
changeValue = request.security(syminfo.tickerid, 'D', (close/close[1]-1)*100)
Display of the Metrics in the Chart
The metrics are displayed in a dashboard. For this, we use the table.new function. The table.new function expects parameters for the position of the dashboard in the chart, the number of rows and columns, and the orientation of the dashboard.
// Design Variables for Table
var numberColums = 6 // standard initialization
var numberRows = 1 // standard initialization

if tableOrientation == "vertical"
    numberColums := 1
    numberRows := 6

var table t = table.new(tablePosition, numberColums, numberRows, border_width = 3)
posColor = color.rgb(38, 166, 154)
negColor = color.rgb(240, 83, 80)
neutralColor = color.new(#999999, 0)
lightTransp = 90
avgTransp = 80
heavyTransp = 69

// Fill Table with ADR
f_fillCellADRValue(_table, _column, _row, _value, _threshold = 0) =>
    _c_color = _value >= _threshold ? posColor : negColor
    _transp = _value >= _threshold ? lightTransp : heavyTransp
    _cellText = str.tostring(_value, "0.00") + "%\n" + "ADR"

    table.cell(_table, _column, _row, _cellText, bgcolor = color.new(_c_color, _transp), text_color = _c_color)

// Fill Table with Change
f_fillCellchangeValue(_table, _column, _row, _value, _threshold = 0) =>
    _c_color = _value >= _threshold ? posColor : negColor
    _transp = _value >= _threshold ? lightTransp : heavyTransp
    _cellText = str.tostring(_value, "0.00") + "%\n" + "Chg"
    table.cell(_table, _column, _row, _cellText, bgcolor = color.new(_c_color, _transp), text_color = _c_color)

if barstate.islast
    if tableOrientation == "horizontal"
        f_fillCellADRValue(t, 0, 0, adrValue, adrThresh)
        f_fillCellchangeValue(t, 1, 0, changeValue)
    else
        f_fillCellADRValue(t, 0, 0, adrValue, adrThresh)
        f_fillCellchangeValue(t, 0, 1, changeValue)
Conclusion
In this article, you learned how to develop an indicator for TradingView. As an example, we developed an indicator that displays the key metrics for analyzing stocks. You can view and use the finished indicator here¹ for free.
Ressourcen
¹: Hierbei handelt es sich um einen Werbe- oder einen Affiliate-Link. Wenn du auf diesen Link klickst, etwas kaufst oder abschließt, erhalten wir (je nach Anbieter) eine Provision. Dir entstehen dadurch keine Mehrkosten und du unterstützt unser Projekt. Wir danken dir für deinen Support.