What is the Bollinger Bands Indicator?
The Bollinger Bands Indicator was developed by John Bollinger in the 1980s. Essentially, the indicator follows the theory that prices are closely related to the normal distribution of past prices.
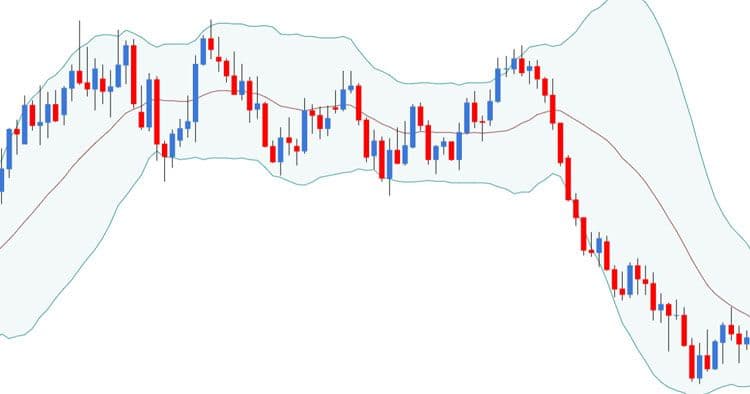
The indicator consists of three elements: a simple moving average (SMA) and two lines representing the standard deviation above and below. The central moving average is calculated using a period of 20 and the two standard deviations are calculated with a default factor of 2.

Example representation of Bollinger Bands in chart
These three elements visually result in three staggered lines that can either contract or expand. This is also where the term Bands comes from. This indicator draws a band on the chart in which the price of a stock moves.
Using Bollinger Bands in trading
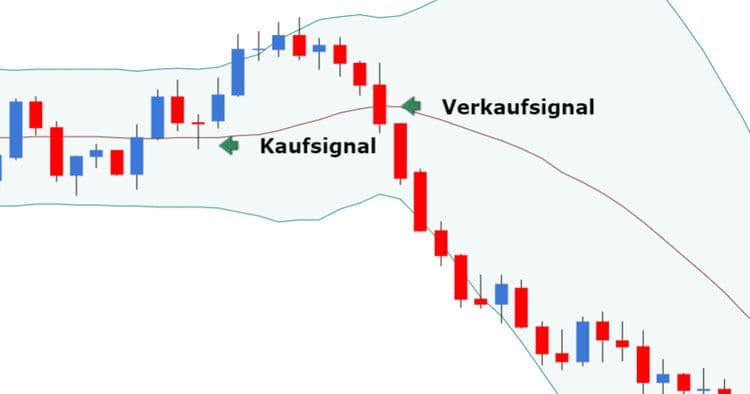
Since the indicator combines several technical indicators (the simple moving average and the lines of standard deviation), we can make a better statement by combining them. For example, if the price bounces off the lower Bollinger Band and then closes above the moving average, this is often interpreted as a buy signal. Conversely, if the price bounces off the upper band and closes below the moving average, this could be interpreted as a sell signal.

Identification of trading signals using the Bollinger Bands Indicator
The indicator not only serves as a signal for a possible entry, but can also be used for targets and stop loss. For example, if we enter a long position, touching the upper Bollinger Band could serve as an exit signal. Furthermore, the stop loss could be placed below the moving average or below the lower Bollinger Band, depending on the position of the entry.
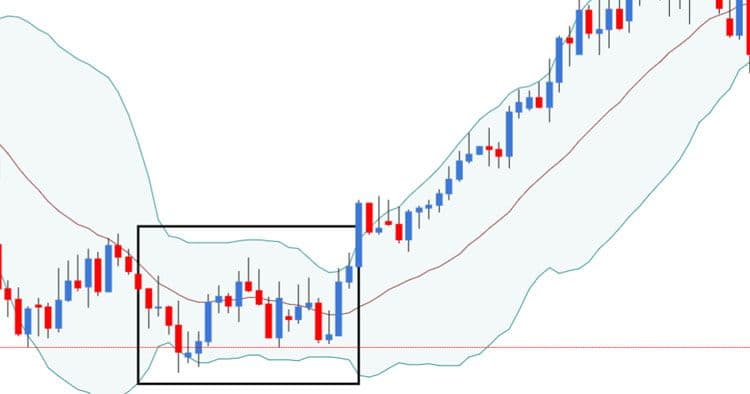
Another interpretation is the width of the Bollinger Bands, which represents market volatility. If the Bollinger Band contracts and the price is near the moving average, a breakout in either direction can be expected.

Bollinger Bands as an indicator of a possible upcoming breakout
The black rectangle clearly shows how the bands (the two standard deviations) contract. Market volatility decreases, indicating an upcoming breakout from the bands. Finally, in this example, exactly that happens: the price leaves the narrow frame of the indicator and an impulsive uptrend begins.