We have all seen them before, and maybe even heard a lot about them: Gaps. Gap trading is one of the basic skills of every successful trader. In this blog post, we will answer the most common questions about gaps and gap trading, introduce the different types of gaps, and compare these different gap types at the end.
What are gaps, and how are they formed?
Gaps are created when the price of a stock changes unexpectedly while the market is closed. Gaps can occur in both trading directions. For example, if Apple's price closed at $110 the day before and opened at $115 the following day, the chart shows a gap. Generally speaking, we can say one thing about gaps: upward gaps are bullish, while downward gaps are bearish.
But how exactly are these gaps created? Simply put, the stock (or other trading instrument) shows an extraordinary buying or selling pressure during the closed market. This is also the reason why we rarely see gaps in forex pairs (except for important news or over the weekend). The market is open 24 hours a day, five days a week. It is different in the stock markets, though. An example is the release of quarterly earnings. These are usually announced before or after the market opens. This causes many market participants to act and trade based on these new quarterly figures in the so-called after-hours or pre-market.
Upward gap: The opening price must be higher than the highest price from the previous day.
Downward gap: The opening price must be lower than the lowest price from the previous day.
What timeframes do gaps occur in?
Gaps can occur in daily, weekly, and monthly charts. The volume provides crucial insight into whether the gap should be considered significant. Gaps most commonly occur in the daily chart because every day offers an opportunity to form an opening gap. For a gap on a weekly basis, a gap would have to occur over the weekend, and for a monthly gap, it would have to happen at the end of the month.
What gap types are there in gap trading?
As you may have noticed, there are different events that can cause gaps to occur. These events and the associated mass psychology determine the behavior of the traders. To make your gap trading successful in the future, you need to know the following: What gap types are there? How can we recognize them? How significant are the gaps? What do the numbers say about this type?
Common Gaps - Ordinary Price Gaps
The common gaps are usually not significant. There is no important news and consequently no great interest in this stock. They occur when the overall market "gaps" or when dividends are paid out, for example. The volume remains unchanged, which leads to the gap closing quickly. This gives you a first indication of which stocks you should use gap-close strategies for!
Breakaway Gaps - Breakout Gaps
Breakaway gaps occur when we break out of consolidations. Read the article on technical analysis to better understand market movements. We know supports and resistances. We run them over a long period of time within the consolidations. So one side demands true strength. Do the buyers or sellers win in this scenario? If we now break out of this consolidation, we should also be able to see increased volume! This gives an indication that one side is really winning.
But when should the volume occur? Before or after the breakout? This is an important question. Let's use a simple analogy, whether it seems familiar to us or not. An escape from prison. Do we apply all our strength (volume) before or after the breakout?
- Scenario 1: We have exerted a lot of effort to break out. I am not familiar with the exact techniques, but we know what is meant. The wall has been torn down. The escape starts. End. We run exhausted. The well-fed guard had more stamina.
- Scenario 2: We are well-prepared, we have saved our strength. The effort, the strength, and the volume have not increased before the planned escape. As soon as the escape starts, the volume or our strength increases. We have a better chance of escaping.

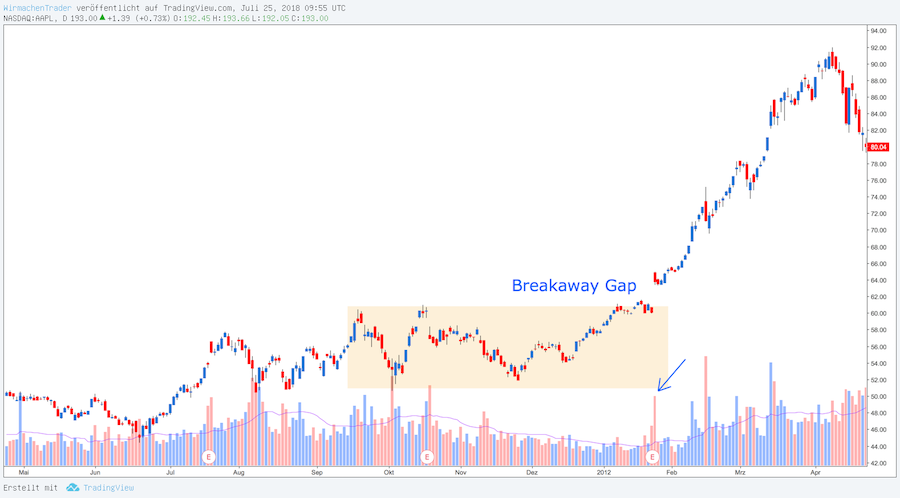
A breakaway gap in the daily chart of Apple
Let's take an example from the stock market. Apple (AAPL) consolidated for several months between $52 and $62 before breaking out with a large gap under increased volume. Breakaway gaps often occur as a result of classic consolidation patterns. These include rising/falling triangles, head & shoulder formations, rectangles, channels, and more. The movement is usually continued in the direction of the gap. The first price target can be the simple range, which would have been reached at around $72.
Runaway Gaps - Continuation Gaps
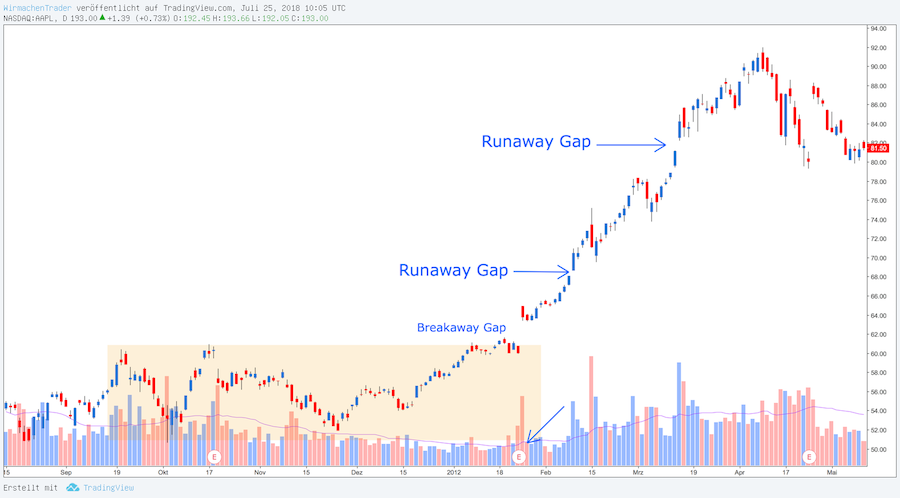
The runaway gaps are very similar to the previously learned breakaway gaps. The difference is that a trend already exists in the case of runaway gaps. This trend is continued with the gaps. We can again use Apple as an example.

The runaway or continuation gap in the daily chart of Apple
After the long consolidation, we initiated the uptrend with the breakaway gap, and further gaps occurred at the market opening. Here, too, we can see increased volume (although lower than with the breakaway gap), which provides information about the sustainability of the gap. The cause of this is often further industry-specific news that drives the stock. Furthermore, more and more analysts follow, improving and raising the ratings and price targets of the stock. In this case, too, it makes sense to trade with the trend and in the direction of the gap.
Exhaustion Gaps
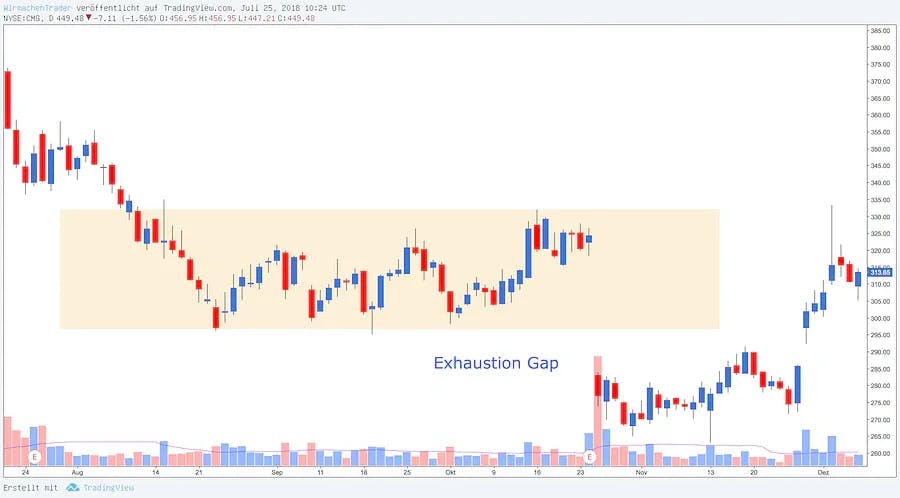
Exhaustion gaps often indicate trend reversals. Unlike the other gap types, the trend is not continued promptly. On the contrary. The gap is closed. This can take several days or weeks.
In the following illustration, we can see such an exhaustion gap. The gap was closed within a month after the announcement of the quarterly figures.
Note: If the trend is not continued promptly after a gap, this may indicate an exhaustion gap. It is worthwhile to manage the position closely. It is even conceivable to trade the potential closing of the gap. However, this is rather recommended for advanced traders with good discipline and risk management.

An exhaustion gap in the daily chart of Apple
Statistics in Gap Trading
Finally, let's take a look at some statistics on the different gap types in gap trading. At this point, I can recommend Thomas N. Bulkowski's Encyclopedia of Chart Patterns*. This is a statistical masterpiece. Therefore, it is boring to read. Nevertheless, the information contained therein is valuable!

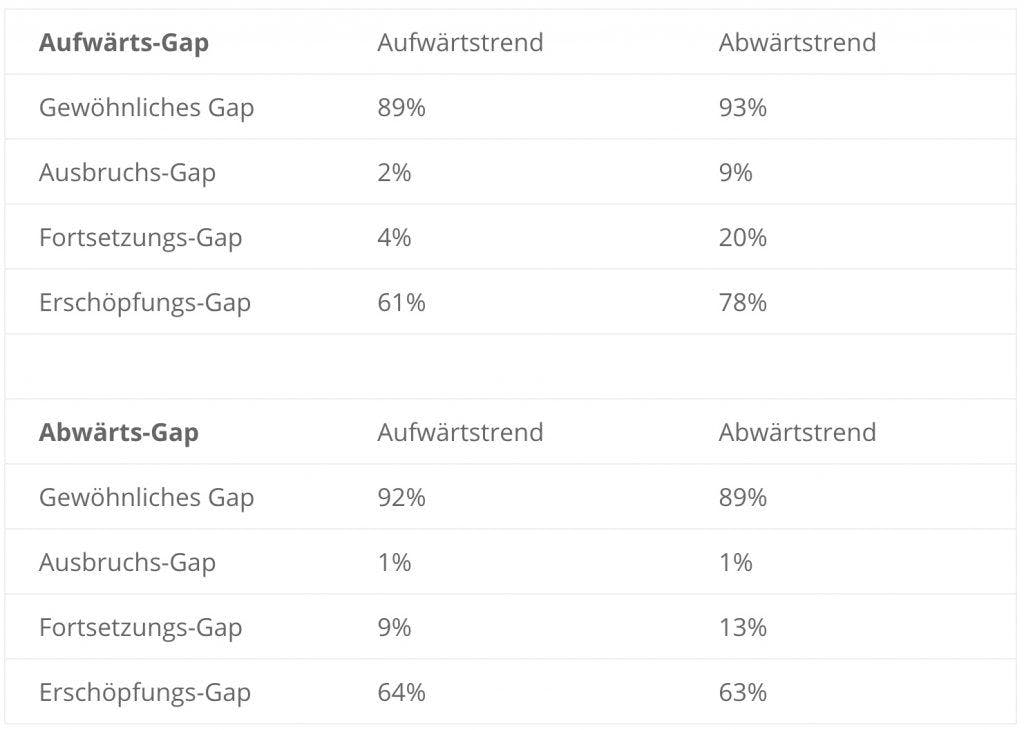
Statistics on gap trading from Bulkowski's Encyclopedia of Chart Patterns
In the table above, you can see the probabilities of a gap-close within the first week. As mentioned earlier, this is often the case with common gaps. In his work, Bulkowski also distinguishes between upward and downward trends. Therefore, if you want to focus on the best gaps, those with a low probability of closing are the ones to go for. Or you can choose a gap-close strategy and use the common gaps for this purpose.
Finally, it is not necessarily important that you know the names of the gaps. Whether breakaway or runaway. What is important is that you can understand the volume and psychology of the market participants. If you combine this understanding with the understanding of technical analysis, you are definitely well-equipped!
Summary
- Gaps are created by increased buying or selling pressure during after-hours and pre-market
- There are four different gap types (common, breakaway, runaway, and exhaustion gaps)
- Breakaway and runaway gaps should run quickly in the anticipated direction. Otherwise, it could be an exhaustion gap
- Common gaps close with a high probability within the first week
- Gaps with high volume are more significant
*This is either an advertisement or an affiliate link. If you click on this link and make a purchase or complete a transaction, we (depending on the provider) may receive a commission. You will not incur any additional costs and you will support our project. We thank you for your support!