As a passionate trader, I know how important visual support can be when analyzing charts. Some time ago, I received an email from a follower of my YouTube channel that inspired me to delve deeper into the possibilities of TradingView.
The sender of the email asked if it would be possible to automatically create chart background colors based on certain indicators - for example, a light gray field when the EMA (Exponential Moving Average) 3 rises above the EMA 15, and a dark gray one when it falls below.
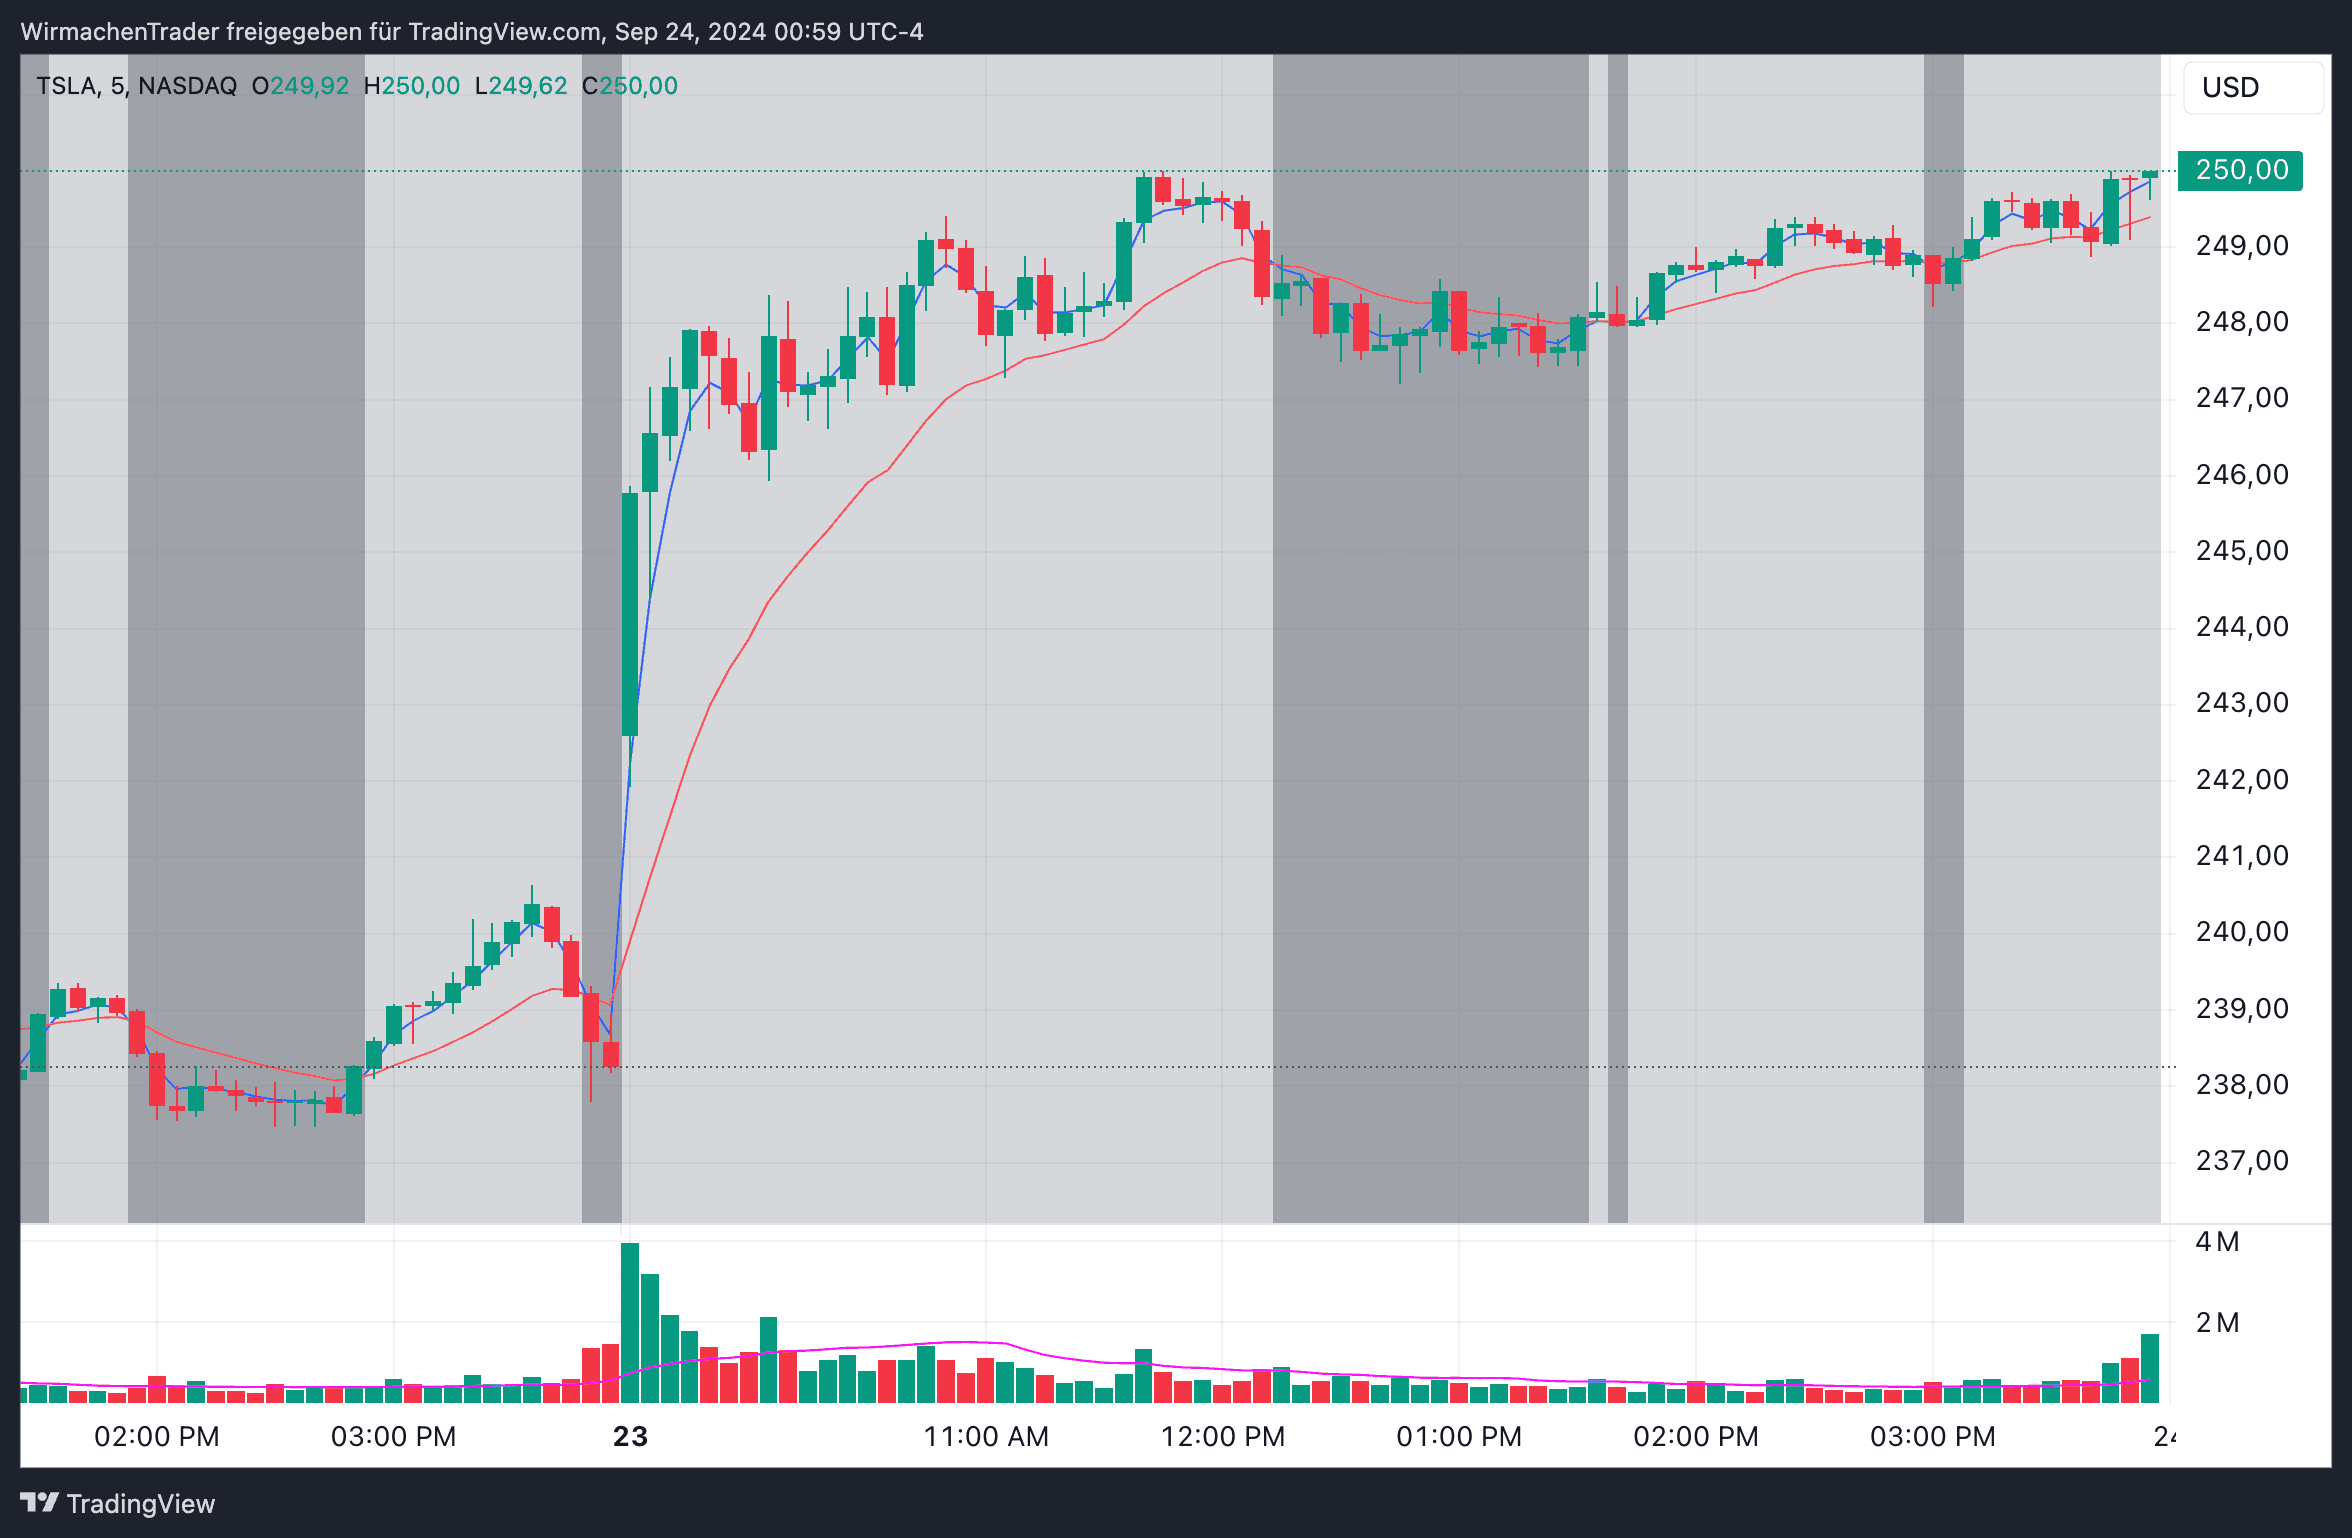
In this article, I want to present you with the result: a TradingView script that automatically generates colored fields based on the relationship between different EMAs. I will guide you step by step through the code, explain how it works, and show you how to adapt it for your own trading strategies.
Goal of the Indicator
Desired backgrounds:
EMA (3) >= EMA (15) = hellgrau
and conversely EMA (3) <= EMA (15) = dunkelgrau
TradingView PineScript to Copy
You can use the following code as a starting point for further scripts.
//@version=5
//@wirmachentrader

indicator("EMA Hintergrund Indikator", overlay=true)

// Input für optionales Plotten
showEmaLines = input.bool(true, title="EMA-Linien anzeigen", tooltip="Aktivieren Sie diese Option, um die EMA-Linien im Chart anzuzeigen")

// EMA-Berechnungen
ema3 = ta.ema(close, 3)
ema15 = ta.ema(close, 15)

// Farbdefinitionen
var color bgColorLight = color.new(color.gray, 70)  // Hellgrau mit 70% Transparenz
var color bgColorDark = color.new(color.gray, 30)   // Dunkelgrau mit 30% Transparenz

// Hintergrundfärbung basierend auf EMA-Verhältnis
bgColor = ema3 >= ema15 ? bgColorLight : bgColorDark

// Hintergrund zeichnen
bgcolor(bgColor)

// EMAs plotten
plot1 = plot(ema3, color=color.blue, title="EMA 3", display=showEmaLines ? display.all : display.none)
plot2 = plot(ema15, color=color.red, title="EMA 15", display=showEmaLines ? display.all : display.none)
To use the PineScript, you need to open the Pine Editor, copy the script in, and add it to the chart. Of course, you can also save this script for yourself. Have fun!
You can find the video on creating the script here.