Anyone who has ever delved deeper into trading will have come across the term trend lines. Trend lines are these lines on which the entire market obviously orients itself and at which the price of a stock magically comes to a halt and reverses. In retrospect, one often thinks that this line is very obvious and regrets not having seen it.
This blog post is all about these trend lines and how you can reliably recognize, draw, and improve your trading on the chart.
How to draw trend lines - in 4 steps
Before you can draw a trend line in the chart, you need reference points. The highs & lows, including the so-called swings, serve as reference points. It is important that you use clearly recognizable highs and lows, and do not identify every small movement as such. Be a little abstract and try to use only the really relevant highs and lows.
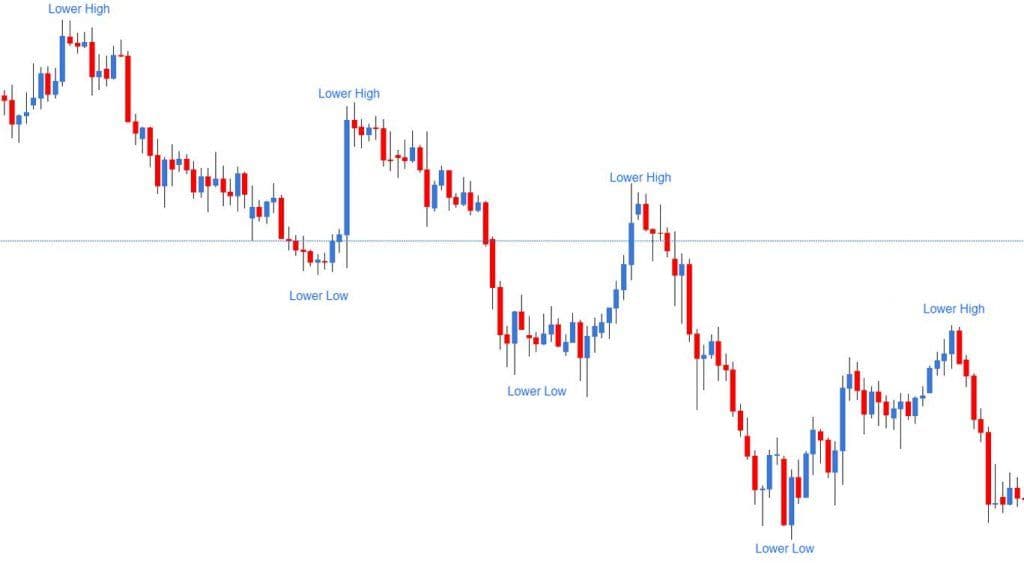
Exemplary identification of lower highs and lower lows in a downtrend
By connecting the highs & lows with lines, we get the swings.
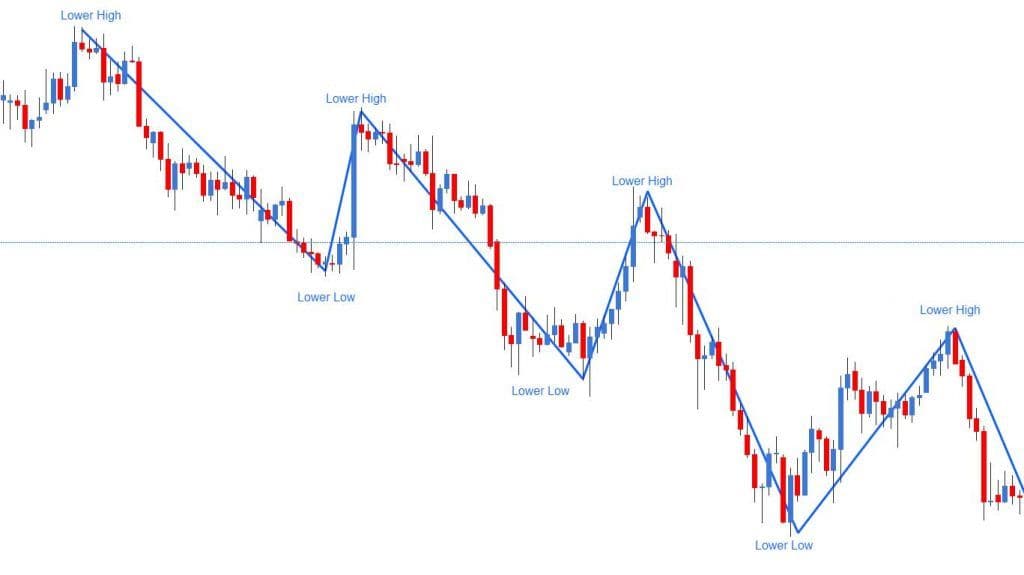
In the next step, the points are connected with lines to form swings
In the next step, the trend lines are drawn. We now have the option of connecting the highs and/or the lows with each other. The first two highs or lows are important here. In the following case, we will take a closer look at the highs that are more relevant in a downtrend. If we take a closer look at the highs, the question arises where we should start our trend line: at the absolute high (top point of the candle) or at the opening price (end of the body of the candle)? Unfortunately, there is no uniform rule for this.
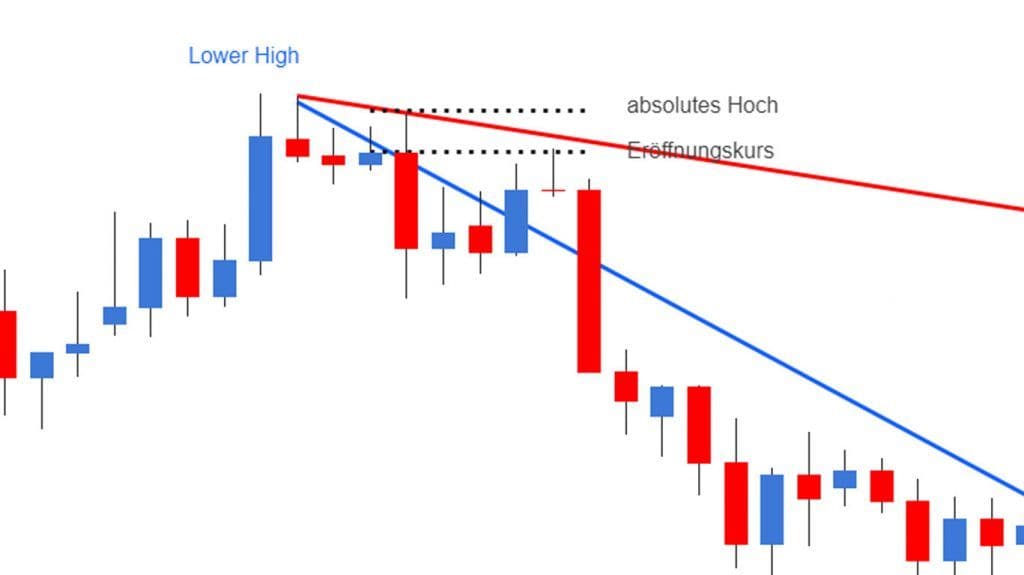
chematic representation of the variance that can occur due to inconsistent drawing of trend lines
We recommend that you either take the absolute high or the opening price. This brings a little uniformity to the process. Then we connect the first high with the second swing. Here, too, we want to connect the trend line with the absolute high or closing price (or opening price in red candles).
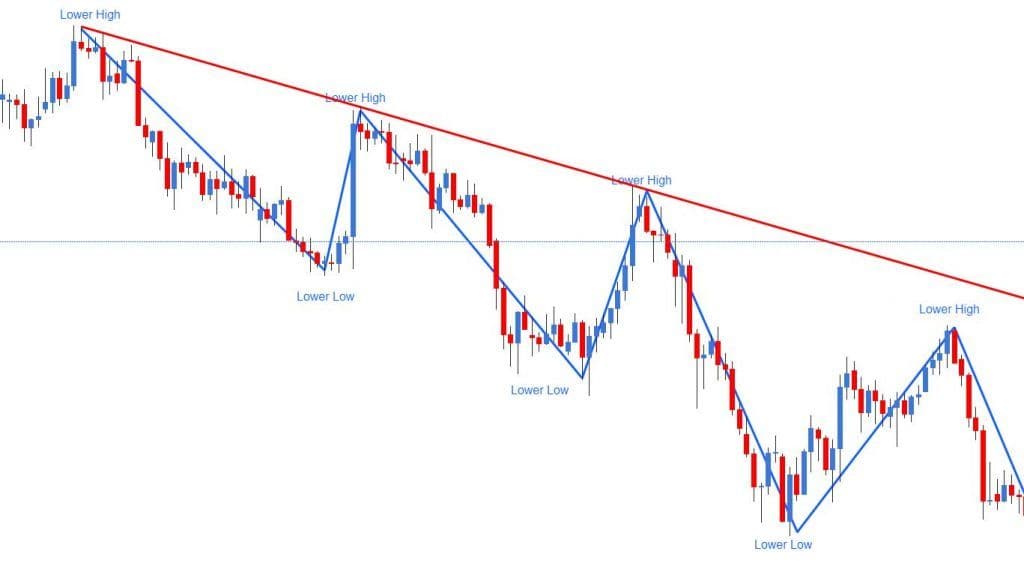
Illustration of the big picture after the swings and trend line have been drawn
A trend line is considered to be drawn correctly, or in other words, as valid, if it has been tested twice. This is the case in the above example. The trend line is touched a total of three times by the lower highs and is therefore considered valid from a trend technical point of view.
Recognizing and drawing trend channels
After we have clarified how to recognize and draw trend lines, we would like to address an extension of these lines. By not only drawing the trend lines on one side of the trend, but on both, channels are created.
If the two trend lines run parallel to each other, this is called a trend channel. This trend channel can be upward or downward. A trend channel serves as an indication that the trend is very clean and probably constructed by large institutions.
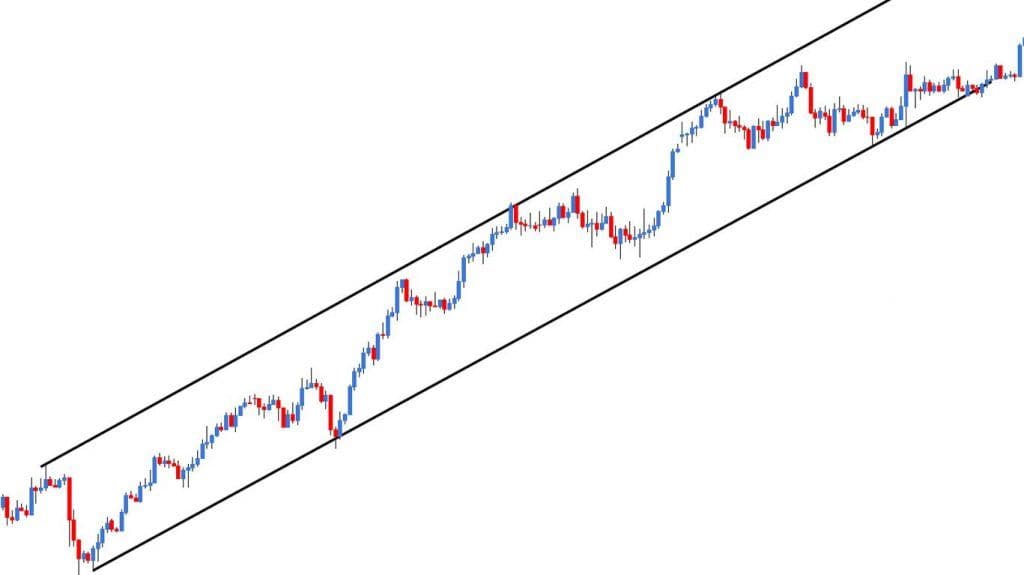
BTwo parallel trend lines are called a trend channel
If two trend lines converge, we have a so-called triangle. The market approaches a central point more and more with the prices. With a triangle, we expect an impulsive breakout in one direction or the other.
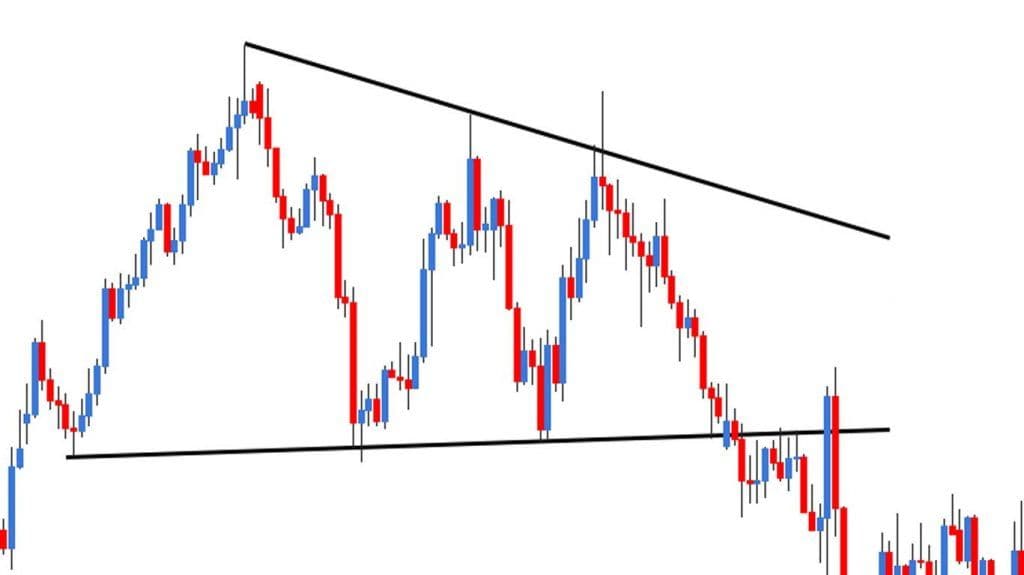
A triangle is formed when two trend lines converge towards each other
These patterns help us better assess the probabilities of future market movements. Potential entries would be possible along the trend lines within the pattern or - with a higher probability - after the actual breakout from the structure.
Trend lines as a tool for your trading
Technical analysis is and remains a popular tool for trading. However, it is important to remember that the lines, trends, etc. that are drawn are highly subjective. With their help, we can only better estimate the likelihood of the anticipated development. Lines like the trend line are never accepted 100%. This means that even with a perfectly drawn line, the price of a stock can go a few cents above it and candles may not close exactly on the line. Instead, consider the trend line as a kind of buffer zone that the price orients itself towards but should not deviate too much from. Because if the price doesn't seem to pay attention to your drawn line at all, your lines were probably not relevant. It is also important to note that you should ideally find and draw the relevant lines and zones that the majority of traders see. Only then are they really relevant and helpful in your trading.
Conclusion
- Trend lines always connect important highs & lows.
- Trend lines connect either to the high/low or to the opening/closing price.
- The 3rd touch confirms the trend line.
- By arranging trend lines, patterns can be created, like trend channels.
- A trend line offers you the optimal entry positions for your strategy.