What is the VWAP indicator?
The abbreviation VWAP stands for Volume Weighted Average Price. The VWAP is a technical indicator that represents the ratio between the price and its total trading volume over a certain period of time. Thus, the VWAP represents the average price of all trading movements within a day.
How is the VWAP calculated?
The VWAP is calculated using the following formula.
VWAP = ∑ Number of shares bought x Price / Total number of shares bought
The following example illustrates the calculation and interpretation of the VWAP.
-
Person 1 buys 100 shares at $10 each at the market opening. These values inserted into the above formula yield a VWAP value of $10.
VWAP = (100 x $10) / 100 VWAP = $10.00 -
Person 2 then buys 300 shares at a price of $8. To calculate the VWAP for the second person, the transaction of the first person must also be considered. Therefore, the following calculation results in a final value of $8.50.
VWAP = ($1000 + $2400) / (100 + 300) VWAP = $8.50 -
A third person buys 200 shares at a price of $11, resulting in a value of $9.33. To calculate the VWAP for the third person, the values of the previous transactions must also be considered, since the calculation of the VWAP indicator is a cumulative calculation method.
VWAP = ($1000 + $2400 + $2200) / (100 + 300 + 200)
VWAP = $9.33
The cumulative calculation of the VWAP makes it clear that the corresponding value of the VWAP deviates from the actual purchase price of the transaction.
Importance of the VWAP Indicator for Trading
The VWAP indicator plays an essential role for institutional investors. The reason for this lies in the daily tasks of these institutions. Just imagine that an institution, such as a large bank, is given the task of buying 10 million shares of Apple. One might think that this is a very trivial matter: The responsible trader of the bank only has to enter the corresponding data into a program and confirm it. But it is not that easy in practice. Because even the traders of the large banks are measured by efficiency indicators. And that is why the VWAP is usually used as a yardstick.
If the purchase price of the trade is below the VWAP, the transaction is rated positively. If the purchase price is above the VWAP, the transaction is rated negatively. Often, the traders also receive monetary rewards if they have executed the orders efficiently. The logic behind this is clear: If the purchase price is below the VWAP, this means that the weighted majority of all other market participants have a higher average price. The lower price thus gives a strategic advantage. The opposite is true if the purchase price is above the VWAP: Then the purchase price is higher than the majority's average price, which is to be regarded as a strategic disadvantage.
Application of the VWAP Indicator
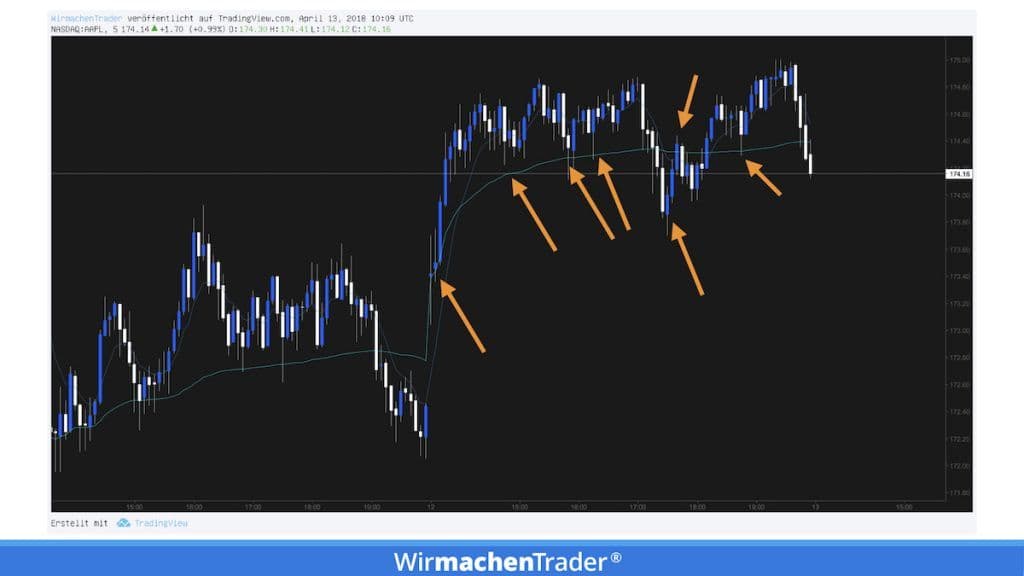
In the following figure, the 5-minute chart of Apple ($AAPL) can be seen. At the opening, we distance ourselves from the VWAP. The buying pressure is high. Therefore, the aim of institutional investors is to buy as close to the VWAP as possible. Therefore, we often see that the price "bounces off" the indicator.

The VWAP in the 5-minute chart. It is clear to see how the price
At a later point, the price holds temporarily below the indicator. Institutions that need to sell stocks should therefore wait for short setbacks to get a better selling price. It seems that buyers are prevailing. The price rises again and leaves the VWAP behind.
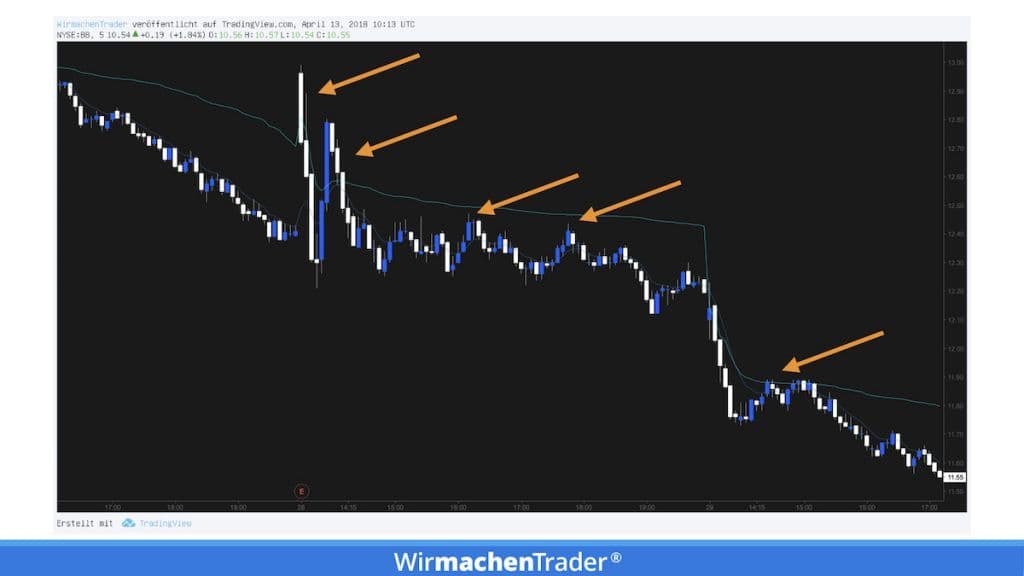
In another example, the chart of Blackberry ($BB) can be seen.

The VWAP in the downtrend in the chart of Blackberry ($BB)
A gap at the opening can be clearly seen, which initially pulls the price above the VWAP. In this situation, let's imagine again that an institutional trader has been given the order to sell 50 million shares. Of course, the trader would never do this with just one order, as this could crash the stock and he would also have problems finding enough buyers to buy his shares. Therefore, this trader works through the order piece by piece and tries to sell as close to the VWAP as possible for each partial order.
Summary
- The normal VWAP is only suitable on an intraday basis (we have also developed a multi-day VWAP).
- The VWAP is only suitable if the real (centralized) volume can be included (stocks, futures).
- If we hold above the indicator, this can be viewed as bullish.
- If we hold below the indicator, we are rather bearish.